We are bringing other news that, thanks to your suggestions, help to constantly improve the WorkSys.Space product itself in its individual parts. In this release, we continue to make improvements in the Performance Dashboard section.
The Performance Dashboard offers easy data viewing and sharing, uncomplicated data analysis, and better control and management of IoT assets. In addition, it enables companies to find previously undiscovered insights, make more effective business decisions in real time, and uncover new prospects for growth or savings. Using more complex information panels in the Performance Dashboard with constantly improving tools, you can easily process your data into graphs without the need for programming skills. You can easily extract useful insights from your data much faster and more transparently, thus easily gaining a competitive advantage.
In the next block, you will find news that you already have on your system and you can start using them immediately.
Performance Dashboard (PD) improvements
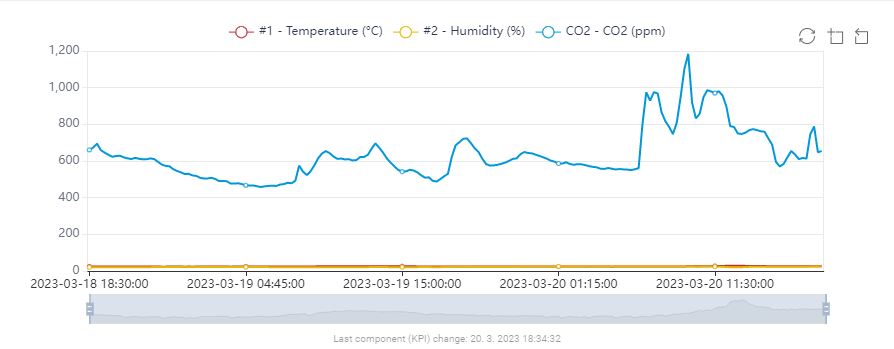
Charts with two Y axes.
Before ...
After ...
Practice has shown that interpolating different types of data on a timeline helps to reveal invisible relationships or connections of data. Often times, however, the difference in the nominal value of the data, e.g. CO₂ and Temperature or humidity. prevented better visualization on the chart. Therefore, we have made it possible to choose two Y axes for the graph, so that the difference in nominal values can be eliminated more easily.
Ability to display a component from PD in full screen
Increasingly, WorkSys panels are appearing as part of the production process itself on the screens on the line. By simply clicking the icon (see image) it is possible to enlarge any component to the full screen (e.g. the current full shift progress of OEE) and to return it to its original state by simply pressing the ESC key.
Thanks to the possibility of including images, video, or other parts of company software that can be linked via iframe (allows you to include content from external sources on your worksys pages) in the component, it is also a good tip for instructions or assembly manuals.
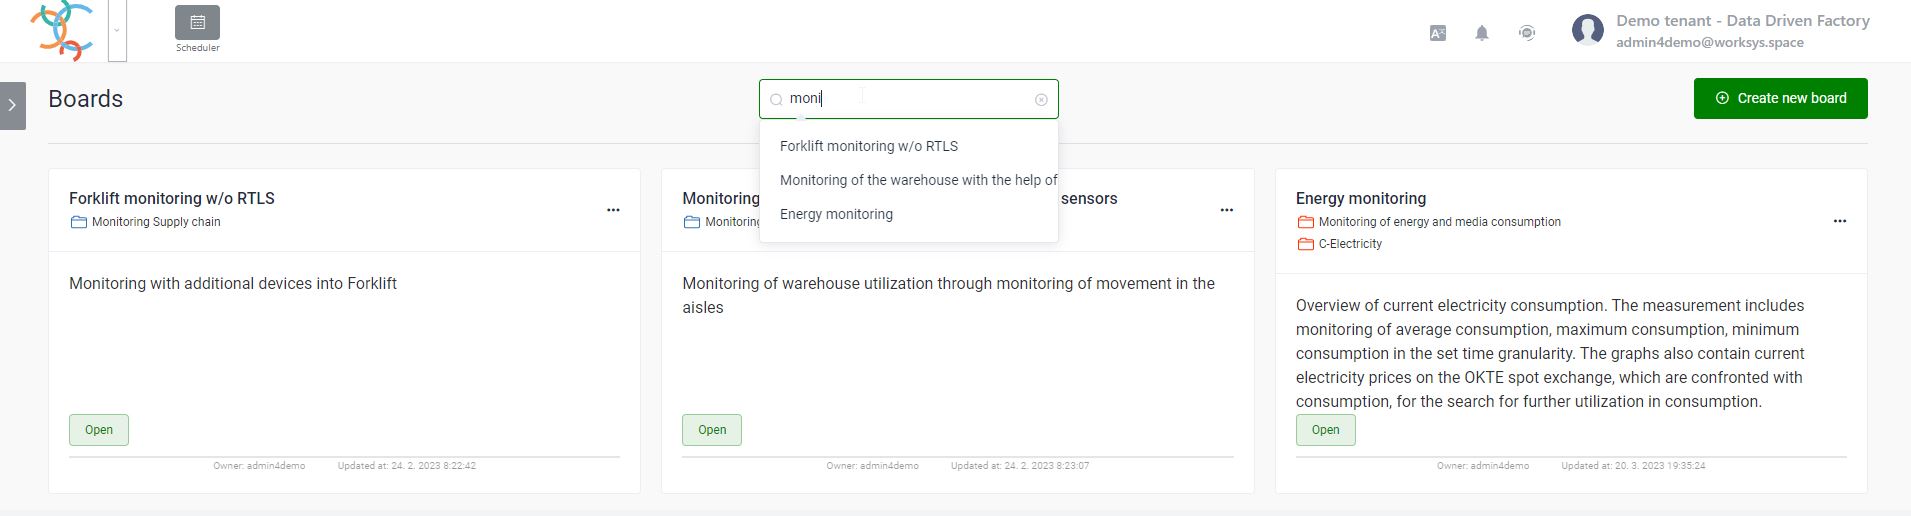
Searching for Panels in the Performance Dashboard
With the increasing number of Panels, the selection based on the classification via the left menu began to appear as an insufficient criterion. That’s why we inserted a search window through which we can query the name, area of the Panel, the owner of the Panel and refine the filtering to the desired detail.
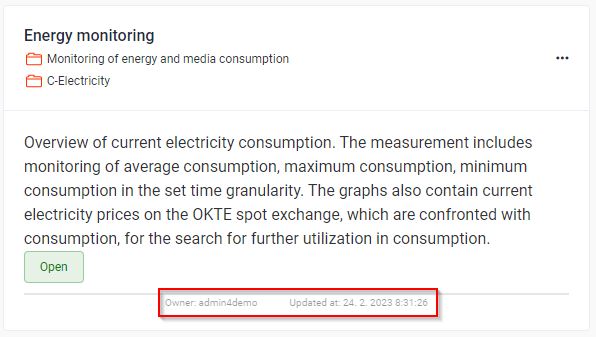
Show the name of the owner, the date, time the Panel was last modified in the Performance Dashboard
Today, it is no longer an exception when the WorkSys user has dozens of different data panels at his disposal. Some he created himself and some were delegated to him. In order to provide him with the greatest comfort, we made visible the name of the owner of the Panel and the date of the last change.
Show the date and time the component definition was last changed
The same goes for components. In order to provide the user with the greatest possible information comfort, we made the date and time of the last change visible.
In this article, we have taken the liberty of highlighting only a few important supplied functionalities. This release also included other minor functional or technological improvements, such as improved mobile responsiveness for individual Panels, or other technological changes that are not visible from the outside. The main goal of WorkSys is to bring permanent improvements to the product, without the need for system downtime or any of your additional costs. To make digitization fun and the search for efficiency, reps. savings paved the way to your company’s prosperity.